
8.2 Sound Waves
How can a sound make something move?

Unit Summary
In this unit, students develop ideas related to how sounds are produced, how they travel through media, and how they affect objects at a distance. Their investigations are motivated by trying to account for a perplexing anchoring phenomenon — a truck is playing loud music in a parking lot and the windows of a building across the parking lot visibly shake in response to the music.
They make observations of sound sources to revisit the K–5 idea that objects vibrate when they make sounds. They figure out that patterns of differences in those vibrations are tied to differences in characteristics of the sounds being made. They gather data on how objects vibrate when making different sounds to characterize how a vibrating object’s motion is tied to the loudness and pitch of the sounds they make. Students also conduct experiments to support the idea that sound needs matter to travel through, and they will use models and simulations to explain how sound travels through matter at the particle level.

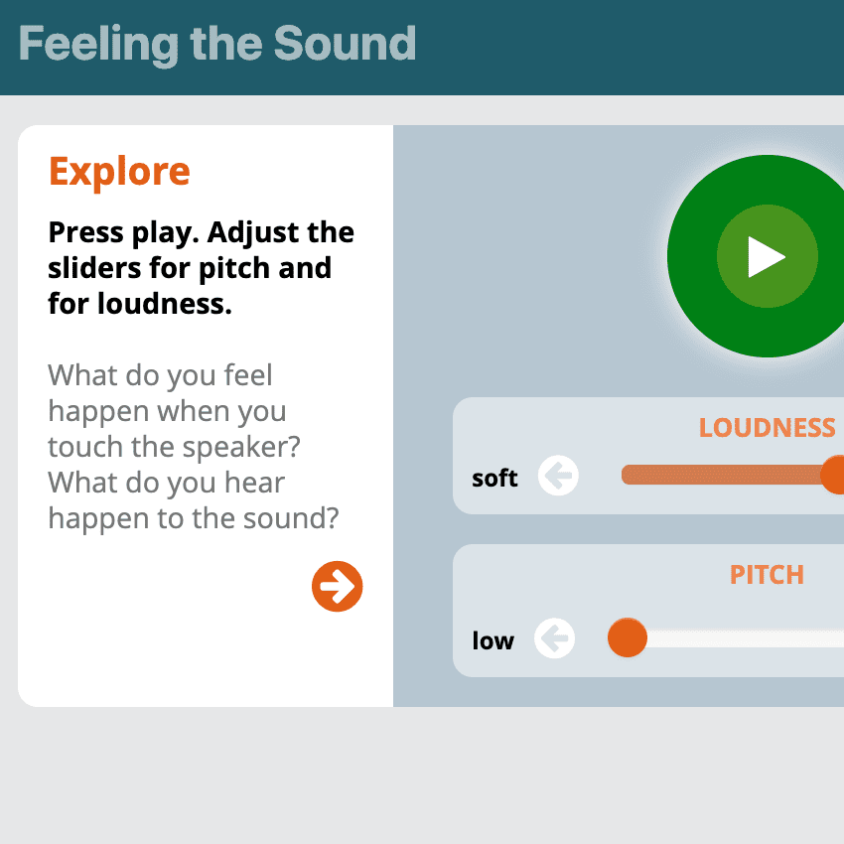
Simulations


Unit Examples
Additional Unit Information
Next Generation Science Standards Addressed in this Unit
Performance Expectations
This unit builds toward the following NGSS Performance Expectations (PEs):
- MS-PS4-1. Use mathematical representations to describe a simple model for waves that includes how the amplitude of a wave is related to the energy in a wave. [Clarification Statement: Emphasis is on describing waves with both qualitative and quantitative thinking.]
- MS-PS4-2. Develop and use a model to describe that waves are reflected, absorbed, or transmitted through various materials. [Clarification Statement: Emphasis is on both light and mechanical waves. Examples of models could include drawings, simulations, and written descriptions.]
Disciplinary Core Ideas
This unit helps develop the following elements of Disciplinary Core Ideas (DCIs):
PS4.A: Wave Properties
- A simple wave has a repeating pattern with a specific wavelength, frequency, and amplitude. (MS-PS4-1)
- A sound wave needs a medium through which it is transmitted. (MS-PS4-2)
Science & Engineering Practices
- Using Mathematics and Computational Thinking: This unit intentionally develops this practice. Mathematical reasoning is key to figuring out the phenomena throughout the unit. The development and analysis of mathematical representations plays a central role in student sensemaking. Lessons 4-6 involve students in novel uses of math representations when they work with the teacher to figure out how to develop and experiment with a scaled up version of the phenomena so they can analyze non visible motions of objects making sound. They represent an object’s motion graphically and use these mathematical representations of position versus time graphs generated from the movement of an object making louder/softer and higher/lower pitch sounds to describe wave patterns (frequency and amplitude) and to figure out how objects making different sounds move. In lesson 10, students look at patterns in the rate of and spacing in between compression bands as a way to measure wavelengths depending on the initial frequency or amplitude. In lesson 13, students will apply their understanding of linear and nonlinear relationships to identify that the energy transferred does not increase in proportion to amplitude and that increasing amplitude increases energy transfer more than increasing frequency. If students have studied exponential relationships they can further characterize the non linear relationship in the graph for amplitude vs energy transferred as an exponential relationship. Students also have the opportunity to construct equations to describe the relationships between these variables in algebraic terms (i.e., energy is related to the amplitude squared)
- Engaging in Argument from Evidence: This practice is key to the sensemaking students do in this unit. Students construct written and oral arguments throughout Lesson Sets 1 and 2. Students construct arguments from evidence about whether all objects
- vibrate when they make sounds; to support an explanation for which patterns of frequency and amplitude of a wave are related to sounds that we can hear; and whether matter is traveling all the way from the speaker to the window. They compare claims about whether air is needed for sound to travel to where we can hear it and use evidence from their investigations to select and defend one of these claims. Students provide critiques about their classmates’ explanations and models and respond to those critiques by citing relevant evidence from their investigations and revising their explanations and models.
- Developing and Using Models: This practice is key to the sensemaking students do in this unit. Although no new elements of this practice are introduced, students use models to make sense of and explain almost every aspect of what they figure out in this unit. Students have frequent opportunities to develop and revise models with a partner, in small groups, or as a class when they are making sense of new science ideas.
- The following practice is also key to the sensemaking in the unit:
- Analyzing and Interpreting Data
Crosscutting Concepts
- Scale, Proportion, and Quantity: This unit intentionally develops this crosscutting concept. Students extend their understanding of phenomena happening at scales we cannot see by using a variety of tools to model and collect data about the vibrations that occur when objects make sounds, and how those sounds transfer energy across media. Lessons 4-6 involve students in novel uses of scale when they work with the teacher to figure out how to develop and experiment with a scaled up version of the phenomena so they can analyze non visible motions of objects making sound. They use the representations developed from using this scaled up object to explain how different sounds are produced. Additionally, students evaluate or help propose other ways of scaling objects throughout the unit in order to provide evidence of what is happening when sounds are made (e.g. slow-motion videos of instruments in lesson 2, laser in lesson 3, simulation in lesson 10). In lesson 13 students use proportional relationships to analyze information from numerical data and graphs of how the energy transferred by a vibration changes with the frequency vs. the amplitude of the vibration. This leads students to conclude that increases in amplitude have a greater effect on the energy transferred by a vibrating object than in frequency.
- Patterns: This crosscutting concept is key to the sensemaking in this unit. In Lessons 1-3 students begin by using patterns to identify cause and effect relationships about sound sources. In Lessons 4-6 they compare and contrast graphical representations of objects moving and identify patterns about how sound makers vibrate differently for low/high pitched or loud/soft sounds. In Lesson 8 students notice patterns across investigations that sounds can be heard when there is matter between them and the sound source and use this pattern to identify that matter is needed for sounds to travel. In Lesson 10 they measure visual patterns in rate change of compression bands to see how changes in frequency and amplitude at the sound source affect the rate of movement of matter in the system. In Lesson 13 they use charts and graphs to identify patterns in rates of change as they discover that energy is transferred differently for increases in frequency versus amplitude of vibrations.
- Energy and Matter: This crosscutting concept is key to the sensemaking in this unit. Students use what they figured out about energy transfer in prior units to figure out how the transfer of energy from a force causes a sound source to vibrate (lessons 2-6) which transfers energy to neighboring particles across a medium, and those particles collide with another object, transferring energy to make it move (lessons 7-14). Students track the transfer of energy across the system from the sound source to the sound detector.
- The following crosscutting concept is also key to the sensemaking in the unit:
- Cause and Effect
Connections to the Nature of Science
Which elements of the Nature of Science are developed in the unit?
- Science investigations use a variety of methods and tools to make measurements and observations. (NOS-SEP)
- Science assumes that objects and events in natural systems occur in consistent patterns that are understandable through measurement and observation. (NOS-CCC).
- Science carefully considers and evaluates anomalies in data and evidence. (NOS-CCC).
How are they developed?
- Students collect data using a variety of tools including slow motion videos, motion detector, reflected laser beams, and computational simulations.
- Students use a variety of tools to collect data about the patterns in vibrations that occur when objects make sounds, and how those sounds transfer energy across media, such as slow motion video, ultrasonic motion detectors, lasers, and computer simulations.
- Students discuss and use mathematical methods of finding the average of data sets, including calculating mean and median as a way to combine results from different groups in order to improve the accuracy of the class’s data. They work together as a class to decide how to account for or discard outliers in the class’s data in order to best represent what each group found in their investigations.
Unit Placement Information
What is the anchoring phenomenon and why was it chosen?
Students begin the sound unit by considering an interesting phenomenon: a truck is playing loud music in a parking lot and the windows of a building across the parking lot visibly shake in response to the music. Students generate questions about three aspects of sound phenomena: 1) What makes sound? 2) How does sound get from the truck to the window? 3) Why does the window shake like it does? Students engage in model-based reasoning, argumentation, and computational and mathematical reasoning to develop models to explain these three aspects of the mystery.
Each OpenScied unit’s anchoring phenomenon is chosen from a group of possible phenomena after analyzing student interest survey results and consulting with external advisory panels. We also chose the truck and window phenomenon as the anchor for this unit for these reasons:
- This familiar phenomenon provides a rich context for students to engage with all the Disciplinary Core Ideas (DCIs) that are bundled with the Performance Expectations of the unit.
- Hearing loud sounds and sounds with different pitches are common experiences for students and allow students to draw on a wide range of students’ own experiences with other related phenomena.
- The field test of this anchor produced driving question boards on which the majority of the students’ questions and ideas for investigations/sources of data needed to answer those questions, were anticipated by the unit development team and were specifically targeted in the field test version of the storyline.
How is the unit structured?
The unit is organized into three main lesson sets, each of which help make progress on a sub-question related to the driving question for the entire unit. Lessons 1-6 focus on how different sounds are made. Students will figure out that patterns of differences in vibrations are tied to differences in characteristics of the sounds being made. These lessons are designed to push students to develop a mechanism for what causes vibrations in matter. That mechanism, the elasticity of solids, is at the heart of understanding how sounds can be produced, why they travel, and how they are sensed/detected, and is then built upon in later lessons. Lessons 7-11 focus on how sound travels. They use interactive computer models and other materials to figure out how sound travels from one location to another by causing sequences of vibrations through matter. Lessons 12-14 focus on what is happening at the sound receiver including how we hear and how higher amplitude sounds can cause damage to our ears.
Where does this unit fall within the OpenSciEd Scope and Sequence?
This unit is the second OpenSciEd 8th grade unit and designed to be taught just after OpenSciEd Unit 8.1: Why do things sometimes get damaged when they hit each other? (Collisions Unit) in the OpenSciEd Scope and Sequence. As such, it can leverage ideas about the transfer of energy between colliding objects and the idea that all solid objects are elastic. Additionally, this unit uses ideas developed in OpenSciEd Unit 6.2: How can containers keep stuff from warming up or cooling down? (Cup Design Unit) regarding the spacing between particles is different for a solid and liquid versus a gas and that the particles in liquid or gas are moving and can collide and transfer energy.
How will I need to modify the unit if taught out of sequence?
This is the second unit in 8th grade in the OpenSciEd Middle School Scope and Sequence. Given this placement, several modifications would need to be made if teaching this unit earlier or later in the middle school curriculum.
- If students haven’t developed lines of evidence from previous grades (PS1 in grade 5) that air is matter and therefore air has mass, you may need to conduct additional investigations first to establish these ideas. (e.g. massing a soda bottle before and after opening it; massing a volleyball before and after adding air. )
- If students haven’t developed lines of evidence from previous grades (PS1A in MS) that (a) solids, liquids, and gases are made of particles; (b) the spacing between those particles is different for a solid and liquid versus a gas; and (c) that the particles in liquid or gas are moving, you will need to establish these ideas first. The unit rests on explaining sound as the collision of particles that transfers energy — so so students need to see matter as composed of particles and see how those particles can move, even in solids.
- The idea that moving objects have energy and that this energy can be transferred through collisions needs to be developed prior to this unit.
What mathematics is required to fully access the unit’s learning experiences?
This unit calls upon understandings from all three grade levels in middle school CCSS. Later lessons, in particular, ask students to apply skills and understandings from grade 8 CCSS. Since this unit falls at the beginning of the 8th grade year of the OpenSciEd Scope and Sequence, it’s important to identify which math concepts and skills students may need extra support in applying as these concepts are fundamental to students engaging in Science and Engineering Practices like analyzing and interpreting data as well as using mathematical and computational thinking.
Mathematical concepts and skills from middle school CCSS are used in the following lessons:
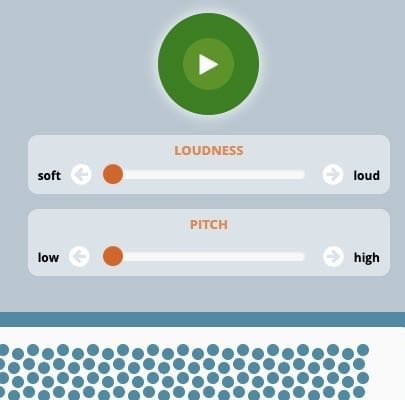
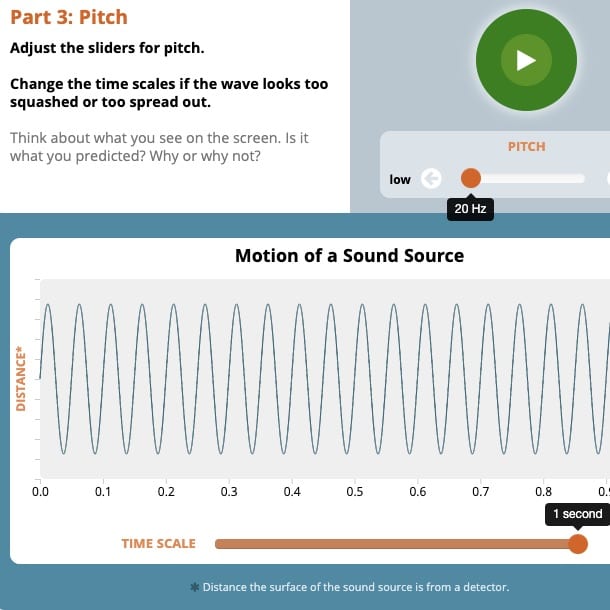
- In Lesson 4, students collect and analyze data in the form of distance vs. time graphs showing the motion of a vibrating stick over time. Students characterize the shape of these graphs as wave patterns, and describe differences in properties like the vertical distance between peaks and troughs of waves when looking at graphs for louder vs. softer sounds. They will also connect the properties of these functions to the physical differences they represent using the axes of the graph to inform what the graph represents. This data analysis calls on the ability to describe the relationship between two quantities using a graph (CCSS.MATH.8.F.B.5) as well as the ability to compare two functions expressed graphically in order to determine key properties about each function (CCSS.MATH.8.F.A.2).
- In Lesson 5, students are expected to exercise these same skills and understandings to interpret differences between graphs of distance vs. time for a stick simulating higher- and lower-pitched sounds. In addition, students define the frequency as the amount of vibrations the stick goes through in a second. They calculate this frequency by finding the unit rate (vibrations per second) using the overall number of vibrations and the total time passed (CCSS.MATH.6.RP.A.2).
- In Lesson 5 and 6, students work independently to interpret graphs of time vs. distance to describe sounds in terms of pitch and loudness using qualitative properties of the functions shown on each graph (CCSS.MATH.8.F.A.2). Depending on the math understandings that students display in Lessons 4 and 5, students might need support in reading and interpreting these graphs. It may help some students to go over the axes of the graph as a class to draw attention to what the graph is showing, and students may benefit from probing questions like, “What differences do you notice between these graphs? How do those differences compare to what we saw in the graphs we made with the motion detector?”.
- In Lesson 13, students discuss and use mathematical methods of finding the average of data sets, including calculating mean and median as a way to combine results from different groups in order to improve the accuracy of the class’s data. They also work together as a class to decide how to account for or discard outliers in the class’s data in order to best represent what each group found in their investigations (CCSS.MATH.6.SP.B.5). Depending on their experience using these concepts in math classes, students may need reminders of how mean and median are calculated. You can support students in recalling these procedures by taking a sample data set (either from the investigation or a random example set) and working together as a class to describe how students could find the mean and median of the set. By doing this with the class or with small groups that could use this extra practice, you can support students with mathematical methods needed to analyze the data the class has collected to draw conclusions about the lesson question.
- Later in Lesson 13, students gather data describing how the energy of a vibration changes with changes to the frequency and amplitude of the vibration. They then use this data to describe and graph functions that represent the relationships between energy and frequency and energy and amplitude. From their numerical data and the graphs they create, students will see that there is a proportional relationship between frequency and energy transferred; when we increase the frequency of the vibrations, the energy transferred increases in proportion (CCSS.MATH.7.RP.A.2). While frequency and energy have a linear relationship, amplitude and energy have a nonlinear relationship where increasing amplitude causes much greater increases in energy compared to increasing frequency. Some students may recognize the pattern on the amplitude vs. energy graph as exponential, where increasing amplitude causes a much greater increase in energy than in a linear relationship like that between frequency and energy (CCSS.MATH.8.F.A.3).
- By the end of Lesson 13, Students are expected to use these qualitative properties of the graphs for frequency vs. energy and amplitude vs. energy to conclude that the energy vs. amplitude function has a greater rate of change than does the energy vs. frequency function (CCSS.MATH.8.F.A.2). Depending on students’ experience with linear and nonlinear functions, students may identify these differences in different ways. Some students may only be able to state that the amplitude vs. energy graph is steeper or increases more quickly, and they may need support in connecting this observation to the idea that increasing amplitude causes a greater increase in energy compared to frequency. Further, some students may benefit from using the data tables they generate in their investigations to find numerical patterns to support their observations of the two graphs. In this numerical data, for example, they might notice that doubling the frequency doubles the energy but doubling the amplitude makes the energy increase by 4 times. These numerical patterns may be helpful to call out and emphasize for students who are still developing their skills at reading and analyzing graphs.
How do I shorten or condense the unit if needed? How can I extend the unit if needed?
The following are example options to shorten or condense parts of the unit without eliminating important sensemaking for students:
- Lesson 3: If students have completed the Collisions Unit they will have established the idea that all objects bend. You could shorten this lesson to only focus on how the vibration changes with more force.
- 8 and 9: Depending on students’ understanding of particle motion and behavior, you could condense these lessons..
- Lesson 11: This lesson provides an opportunity to apply what they have learned to a new phenomenon and to get feedback from peers before then individually revising their model for the anchoring phenomenon. If short on time, you could use either phenomenon and still have students give feedback and revise that one model.
- Lesson 12: If short of time, this lesson could be skipped. Usually there will be a category of questions around hearing and how we hear sounds so this lesson helps to fully close out the DQB. In addition, the DCI LS1.D is spread across multiple units in OpenSciEd, this being one of them. So if this lesson is skipped during this unit, more time or support might be needed in one of the other units that address this DCI (One-way Mirror Unit, Healing Unit, Collisions Unit, and Bath Bombs Unit).
To extend or enhance the unit, consider the following:
- Lesson 6: We added two supplemental investigations in Lesson 6. In supplemental investigation 6A students can use a camera phone and wooden coffee stirrers to explore the relationship between how changing one variable (e.g. length of stick, thickness of sticks) affects the frequency of vibrations in the video to try to address this. It is currently designed as a differentiation option for students and teachers. Supplemental investigation 6B provides students with an opportunity to explore how our voices can make different kinds of sounds.
- Additionally, several readings are included that could extend the learning. Some readings, such as the Big Ben reading (Lesson 3) is at a slightly higher lexile and could be used independently for those students who are at a higher reading levels or in pairs or small groups for those needing more support. Similarly, in lesson 12, there are 2 additional readings. The second reading allows students to connect what they learned about the human ear to variations in the structure and range of hearing (function) in different animals (explaining a new phenomena) (Lexile 1200-1300). Finally, a third optional reading is included to provide a differentiation option about how humpback whales hear and produce sound (Lexile 1000-1100).
- All lessons: Remove scaffolds provided with Science and Engineering Practices as a way to give students more independent work with the elements of these practices.
Unit Acknowledgements
Unit Development Team
- Renee Affolter, Unit Lead, Boston College
- Susan Kowalski, Field Test Unit Lead, BSCS Science Learning
- Gail Housman, Writer, Ideal Elementary School
- Jamie Noll, Writer, Northwestern University
- Tyler Scaletta, Writer and Pilot Teacher, North Shore Country Day School
- Michael Novak, Reviewer, Northwestern University
- Chris Newlan, Pilot Teacher, David Wooster Middle School
- Sara Ryner, Pilot Teacher, United Junior High School
- Katie Van Horne, Assessment Specialist
Production Team
BSCS Science Learning
- Stacey Luce, Editorial Production Lead and Copyeditor
- Valerie Maltese, Marketing Specialist & Project Coordinator
- Alyssa Markle, Project Coordinator
- Chris Moraine, Multimedia Graphic Designer
Additional Acknowledgement
This unit was adapted from How Can We Sense So Many Different Sounds From a Distance?, originally developed by the Next Generation Science Storylines project at Northwestern University. Used with permission. How Can We Sense So Many Different Sounds From a Distance? was developed with support from the Gordon and Betty Moore Foundation to Northwestern University and support from the NGSX Project at Clark University, Tidemark Institute, and Northwestern University.
Unit External Evaluation
EdReports
EdReports awarded OpenSciEd an all-green rating for our Middle School Science Curriculum in February 2023. The materials received a green rating on all three qualifying gateways: Designed for the Next Generation Science Standards (NGSS), Coherence and Scope, and Usability. To learn more and read the report, visit the EdReports site.
NextGenScience’s Science Peer Review Panel
An integral component of OpenSciEd’s development process is external validation of alignment to the Next Generation Science Standards by NextGenScience’s Science Peer Review Panel using the EQuIP Rubric for Science. We are proud that this unit has earned the highest score available and has been awarded the NGSS Design Badge. You can find additional information about the EQuIP rubric and the peer review process at the nextgenscience.org website.

Unit standards
This unit builds toward the following NGSS Performance Expectations (PEs) as described in the OpenSciEd Scope & Sequence:
- MS-PS4-1
- MS-PS4-2
Reference to kit materials
The OpenSciEd units are designed for hands-on learning and therefore materials are necessary to teach the unit. These materials can be purchased as science kits or assembled using the kit material list.
NGSS Design Badge
Awarded: Jul 13, 2020
Awarded To: OpenSciEd Unit 8.2: How Can Sound Make Something Move?

