
8.6 Natural Selection & Common Ancestry
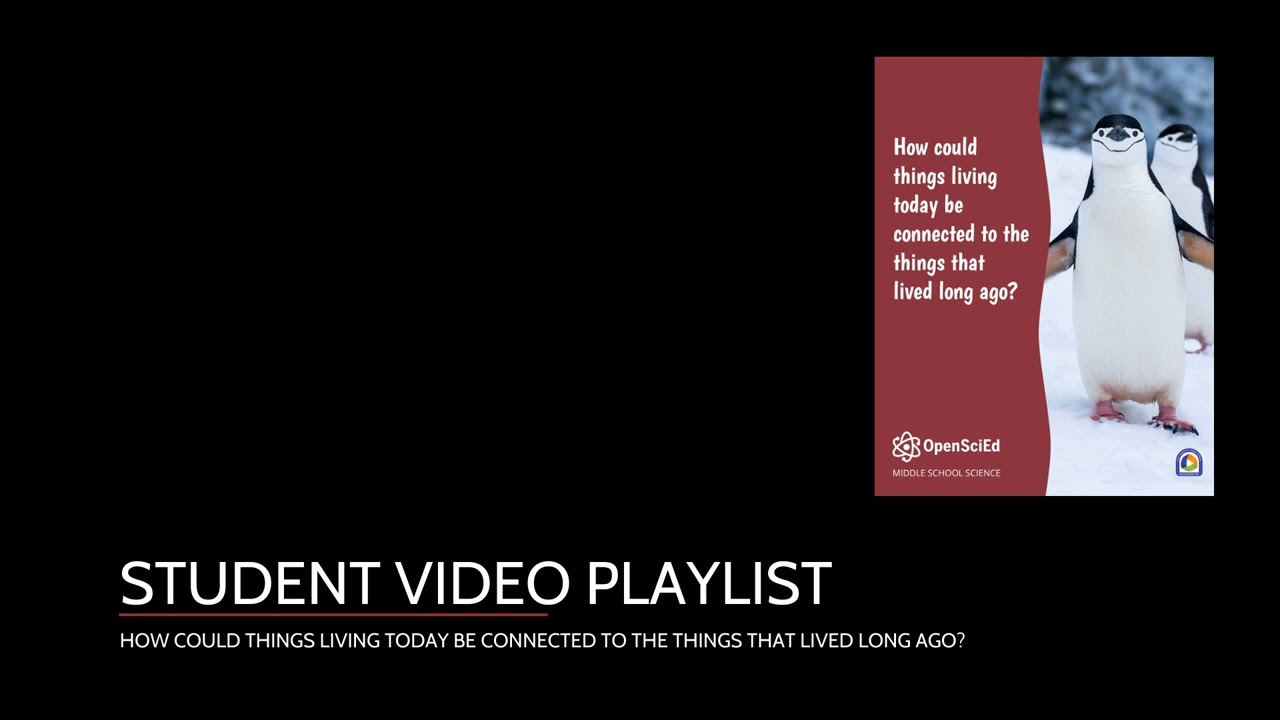
How could things living today be connected to the things that lived long ago?
Unit Summary
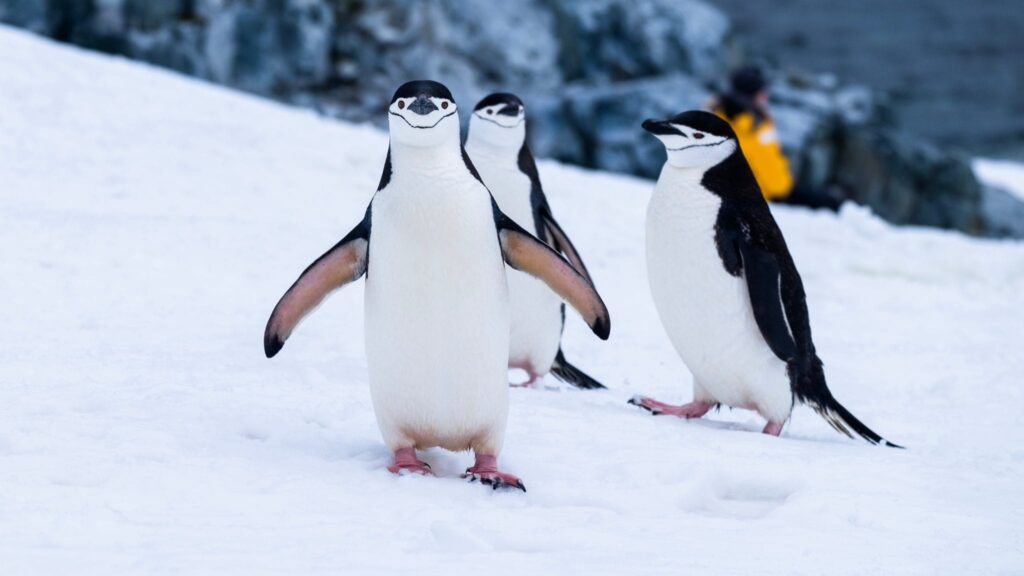
At the beginning of this unit, students hear about the surprising fossil of an ancient penguin (nicknamed “Pedro”) in a podcast from the researchers who found and identified the fossil. Students analyze data about modern penguins and Pedro to develop initial explanations for how these penguins could be connected. They brainstorm about 1) Where did all the ancient penguins go? 2) Where did all the different species of modern penguins come from? and 3) What other organisms alive today might also be connected to organisms that lived long ago?
After exploring variations in body structures and behaviors in modern penguins and ancient penguins, they also analyze data from ancient and modern species of horses, whales, and horseshoe crabs to see whether these organisms have similar patterns. Then, to figure out the cause of the changes they have observed in populations, students explore more recent cases of changing heritable trait distribution in populations and explain them by developing a model for natural selection.
In the last part of the unit, students use their model for natural selection to explain how some body structure variations in different species of modern penguins could result from natural selection and how they could descend from a common ancient ancestor penguin population. They analyze embryological data to their argument supporting how different species may be connected. Finally, students take stock of all the questions they answered in this unit and previous OpenSciEd units and identify questions they look forward to figuring out in high school.
Simulations


Unit Examples
Additional Unit Information
Next Generation Science Standards Addressed in this Unit
Performance Expectations
This unit builds toward the following NGSS Performance Expectations (PEs):
MS-LS1-4.* Use argument based on empirical evidence and scientific reasoning to support an explanation for how characteristic animal behaviors and specialized plant structures affect the probability of successful reproduction of animals and plants, respectively.
MS-LS4-1. Analyze and interpret data for patterns in the fossil record that document the existence, diversity, extinction, and change of life forms throughout the history of life on Earth under the assumption that natural laws operate today as in the past.
MS-LS4-2. Apply scientific ideas to construct an explanation for the anatomical similarities and differences among modern organisms and between modern and fossil organisms to infer evolutionary relationships.
MS-LS4-3. Analyze displays of pictorial data to compare patterns of similarities in embryological development across multiple species to identify relationships not evident in the fully formed anatomy.
MS-LS4-4. Construct an explanation based on evidence that describes how genetic variations of traits in a population increase some individuals’ probability of surviving and reproducing in a specific environment.
MS-LS4-6. Use mathematical representations to support explanations of how natural selection may lead to increases and decreases of specific traits in populations over time.
*PEs marked with an asterisk are partially developed in this unit and shared with other units, as explained in the DCI column of the table in the “What additional ideas will my students have or know from earlier grades or OpenSciEd units?” section that follows.
Disciplinary Core Ideas
The unit expands students’ understanding of particle models and energy transfer, which include these Grade 6–8 DCI elements:
LS1.B. Growth and Development of Organisms: Animals engage in characteristic behaviors that increase the odds of reproduction. Students will develop and use these ideas in Lessons 2, 7, and 11 when they investigate, compare, and contrast the behaviors of various animals. Note that the PE related to this DCI element is shared with [material: GE].
LS4.A. Evidence of Common Ancestry and Diversity
- The collection of fossils and their placement in chronological order (e.g., through the location of the sedimentary layers in which they are found or through radioactive dating) is known as the fossil record. It documents the existence, diversity, extinction, and change of many life forms throughout the history of life on Earth.
- Anatomical similarities and differences between various organisms living today, and between them and organisms in the fossil record, enable the reconstruction of evolutionary history and the inference of lines of evolutionary descent.
- Comparison of the embryological development of different species also reveals similarities that show relationships not evident in the fully formed anatomy.
Students will draw on the above ideas in several lessons. Students analyze and interpret data from the fossil record specifically in Lessons 3, 5, 6, 12, and 13, in which they investigate penguins, horseshoe crabs, horses, and whales. Students use evidence from those investigations to develop their model for how ancient organisms are connected to modern ones over millions of years. In Lesson 14, students investigate how the structures of embryos of different organisms reveal similarities not evident in their fully formed anatomy and use that information as one of the lines of evidence to try to figure out the ancestors and lines of descent for the most ancient penguins and other organisms from their related phenomena.
LS4.B. Natural selection leads to the predominance of certain traits in a population and the suppression of others. Students will develop and use these ideas in Lessons 7-13 when they investigate five different cases, in which for each a trait changed in a population over a few generations, and from there build their General Model for Natural Selection.
LS4.C. Adaptation by natural selection acting over generations is one important process by which species change over time in response to changes in environmental conditions. Traits that support successful survival and reproduction in the new environment become more common and those that do not become less common. Thus, the distribution of traits in a population changes. Students will develop and use these ideas in Lessons 7-13. From the five cases mentioned above, on which they build their General Model for Natural Selection, students determine how changes in a population are related to different environmental conditions. Students test their model using a computer simulation to see how the distribution of trait variations in a population changes because trait variations that support successful survival and reproduction in the new environment become more common and those that do not become less common. Students use their model to explain how populations of descendents that look very different from each other can emerge from a common ancestor due to gradual accumulated changes over time (adaptation).
Science & Engineering Practices
Analyzing and Interpreting Data: This unit intentionally develops this practice as students investigate large data sets for variations in animals’ body structures and changes over time. Although students have had prior experience with this practice, the data sets they use in this unit are the largest and most complex that they have worked with in OpenSciEd. Throughout the unit, students analyze and interpret data from photos, sketches, modern and ancient world maps, organism size comparison charts, timelines, tables displaying multiple categories of body structures, environmental and behavioral information, linear models, histograms, and box-and-whisker plots. Students consider the role of randomness in the simulations they use to describe the shifts in distribution and central tendency of trait variations in populations. The work of this unit requires students to synthesize these data sets in more-complex ways than they did in past units. Students combine evidence from their analyses and interpretation of data about multiple organisms to support the models they develop throughout the unit. The unit provides several different opportunities to assess students’ work in this practice.
Constructing Explanations and Designing Solutions: This practice is intentionally developed in this unit. Students construct explanations throughout the unit as they gather evidence for the mechanism in their General Model for Natural Selection in efforts to explain “Where did all the ancient penguins go?” and “Where did all the different species of modern penguins come from?”
Students have experience with this SEP from prior units, including with long time scales and small changes accumulating over time, but now they are building that kind of explanation in living systems. There are multiple opportunities to assess students’ independent use of this practice throughout the unit, including a peer feedback activity in Lesson 11 during which students respectfully provide critiques about each other’s explanations and respond by adding more elaboration and detail.
Engaging in Argument from Evidence: This practice is key to the sensemaking students do in this unit. Arguing from evidence they have collected from multiple investigations is deeply embedded into students’ work supporting their scientific explanations for how populations of organisms can change over time and how they are connected to those long ago. A key goal of the unit is for students to be able to say not only what they think happened in these cases of natural selection but also how the evidence supports that explanation. Students specifically engage in this practice in Lessons 5, 6, 8, and 14, at which points they can also be assessed.
The following practices are also key to the sensemaking in the unit:
- Asking questions and defining problems
- Developing and using models
- Planning and carrying out investigations
- Obtaining, evaluating, and communicating information
Crosscutting Concepts
Patterns: The crosscutting concept of “patterns” is key to the sensemaking students do around the connections between modern and ancient organisms in this unit, and this crosscutting concept is also frequently assessed. Students use patterns in data to identify cause and effect relationships between the body structures of ancient and modern penguins, then use the patterns they’ve identified to determine that some of the traits in a population of descendents must have been changing over millions of years. Students identify patterns related to the environment, heritability, and survival and reproduction in graphs of case study data and in the data produced by simulations. Students infer relative time spent in different environments based on patterns in the numbers of similar or different body structures between modern and ancient penguin species, and they use sketches of embryos to identify particular similarities (patterns) between the physical structures of different species that are not evident in the fully formed anatomy.
Cause and Effect: The crosscutting concept of “cause and effect” is key to the sensemaking students do in this unit. Students use the CCC of ”cause and effect” across the second lesson set as they develop their General Model for Natural Selection, which then allows them to explain in Lesson Set 3 how ancient and modern penguins are connected through changes over time. Students only just began their work with cause and effect relationships that are probabilistic in the prior [material: GE.n]. Students extend that thinking in this unit when developing and using the ideas that competitive (dis)advantage for particular trait variations are probabilistic in nature and that there is variability in the outcomes of natural selection (e.g., how quickly particular trait variations disappear from a population).
Stability and Change: The crosscutting concept of “stability and change of systems” is key to the sensemaking students do in this unit as students are continually evaluating trait variations in populations before and after an environmental change. In Lesson Set 1, students develop an explanation for “Why are there similarities and differences in the body structures of modern and ancient penguins?” which highlights what has remained stable and what has changed in the different species’ body structures. In Lesson Set 2, students develop the ideas that the trait variations found in a population may shift relatively rapidly due to sudden environment changes and that trait variations found in a large population may remain relatively stable when the environment doesn’t change. Students figure out that seemingly small changes in organisms can accumulate over generations and add up to relatively large amounts of change over long periods of time.
Structure and Function: The crosscutting concept of “structure and function” is key to the sensemaking students do in this unit. Students bring a vast amount of experience with structure and function thinking into this unit from prior work which they now use to support their investigations and make sense of data in almost every lesson. As they consider how organisms could be connected over time, students analyze the body structures of those organisms and consider how they function in similar or different ways and in similar or different environments. The models they develop for natural selection and common ancestry are informed by structure and function thinking.
Connections to the Nature of Science
Which elements of the Nature of Science are developed in the unit?
- Scientific explanations are subject to revision and improvement in light of new evidence. (NOS-SEP)
- Science findings are frequently revised and/or reinterpreted based on new evidence. (NOS-SEP)
- Science knowledge is cumulative and many people, from many generations and nations, have contributed to science knowledge. (NOS-CCC)
- Men and women from different social, cultural, and ethnic backgrounds work as scientists and engineers. (NOS-CCC)
How are they developed?
- Students revise and improve their explanations about how penguins and other ancient and modern organisms are connected across time based on new evidence they discover throughout the unit.
- This unit introduces students to the following scientists from various backgrounds: Ali Altamirano, a researcher in Perú; Julia Clarke, a professor of paleontology at the University of Texas at Austin; Sara Bertelli, a researcher from Argentina. Students use the information these people and their colleagues have collected to build their science knowledge and figure out where ancient penguins and other organisms went and how they’re connected to current species today.
Unit Placement Information
What is the anchoring phenomenon and why was it chosen?
The unit begins with students hearing about the surprising fossil of an ancient penguin (nicknamed “Pedro”) in a podcast with the researchers who found and identified the fossil. Students also read a photo journal from their research. Students question how penguins living today could be connected to this fossil of a much larger penguin from long ago and record their noticings and wonderings. Students then explore the different types of penguins alive today through a series of videos and data cards. Students develop initial explanations for how today’s penguins could be connected to Pedro or other penguins from long ago. Their models explain their ideas about these questions: (a) Where did all the ancient penguins go? and (b) Where did all the different species of modern penguins come from? They expand the range of phenomena to investigate by considering other types of organisms that lived long ago and look different from similar types of organisms alive today. Students then develop a Driving Question Board (DQB) to guide future investigations.
Each OpenScied unit’s anchoring phenomenon is chosen from a group of possible phenomena after analyzing student interest survey results and consulting with external advisory panels. In addition to this process, we chose Pedro and the ancient penguins’ connection to modern penguins as the anchoring phenomenon for this unit for these reasons:
- In the student survey results, investigating fossil-related phenomena ranked higher than questions about different organisms found in different environments today. Among the latter type of phenomena, a question about why different flightless birds are found in some parts of the world and not others ranked higher than one on colorful frogs and one on sticky-footed lizards. In an attempt to blend the need for investigating some line of fossil data related to an organism alive today, we selected penguins as a type of flightless birds that are also charismatic animals that have distinct physical structures and behaviors compared to other birds.
- Due to the accessibility of zoos, aquariums, and pop culture, penguins are relevant to most students as a model organism.
- Penguins have a variety of similar body structures that can show easily recognizable variation between species.
- The penguin fossil record is relatively intact and spans many years.
- Recent discoveries regarding evidence for different types of giant penguin fossils provide a novel line of new data from the field to explore.
- The paleontologists (Dr. Julia Clarke and Sr. Ali Altamirano) who made some of the discoveries concerning Pedro were interested in working with us to reframe their data and research in a way that students could figure out key ideas related to the target PEs for this unit.
- Dr. Julia Clarke and Sr. Ali Altamirano come from backgrounds that are often less represented in science curriculum in the United States.
- A pre-field-release pilot of this anchor produced Driving Question Boards that had over 85% of the students’ questions on them and ideas for the types of investigations and sources of data needed to answer those questions, as anticipated by the unit development team, and were specifically targeted in the field-test version of the storyline.
How is the unit structured?
The unit is organized into four lesson sets, each of which help make progress on a subquestion related to the driving questions for the entire unit. Lessons 1-6 focus on developing science ideas behind common ancestry. Lessons 7-11 focus on gathering evidence to build a general model for natural selection. Lessons 12-13 incorporate the ideas of mutation and sexual reproduction into their General Model for Natural Selection. Lesson 14 transitions to thinking about the anatomical similarities across species during embryologic development. Lesson 15 is a reflection on the progress made on the Driving Question Board and in students’ experience with the OpenSciEd middle school program.

Where does this unit fall within the OpenSciEd Scope and Sequence?
This is the last unit in the OpenSciEd program. This unit is designed to be taught just after Unit 8.5 Genetics in the OpenSciEd Scope and Sequence. Students investigate structures that modern animals do or do not have in common with ancient animals and how certain traits in a population increase some individuals’ probability of surviving and reproducing. As such, it leverages ideas developed in Unit 8.5 about mutations, sexual reproduction, and inheritance.
What modifications will I need to make if this unit is taught out of sequence?
This is the final unit in 8th grade in the OpenSciEd Scope and Sequence. OpenSciEd placed this unit in 8th grade given the science and mathematical ideas and practices that the models in this unit need to build on. Therefore, several important modifications would need to be made if teaching this unit earlier in the middle school curriculum. These include the following:
- If taught before Unit 8.1 Contact Forces or at the start of the school year, be sure to include these supports: supplemental teaching of classroom norms, setting up the Driving Question Board, and asking open-ended and testable questions. These supports are built into the Unit 8.1 and could be adapted accordingly for this unit if needed.
- Given the nature of the target DCIs, this unit relies a great deal on students building on prior understanding of the ideas outlined in the “What are the NGSS dimensions developed in this context?” and “What additional ideas will my students have or know from earlier grades or OpenSciEd units?” sections.
- If this unit is taught before Unit 8.5 Genetics, make sure to provide students with instructional experiences that help them develop the set of related ideas outlined above for LS3.A: Inheritance of Traits, LS3.B: Variation of Traits, and LS1.B Growth and Development of Organisms.
- If this unit is taught before Unit 7.5 Ecosystem Dynamics, make sure to provide students with instructional experiences that help them develop the set of related ideas outlined above for LS2.A: Interdependent Relationships in Ecosystems.
- If this unit is taught before Unit 6.4 Plate Tectonics, make sure to provide students with instructional experiences that help them develop the set of related ideas outlined above for ESS1.C: The History of Planet Earth and ESS2.B: Plate Tectonics and Large-Scale System Interactions.
- If any supplemental instruction is necessary to orient students to the ideas from the three units listed above, it will influence students’ future experiences in those units. Parts of those units will help students figure out the related pieces of the DCI in this unit and, if taught out of order, those concepts will be redundant for students.
- This unit highly relies on 7th-8th grade math (that is often taught later in 7th grade or in 8th grade) .
- If this unit is taught in grade 7, teachers will need to modify the scatterplots and lines of best fit to a more grade-appropriate representation. In addition, teachers will need to work closely with a 7th grade math teacher to understand when students will learn about sampling, certainty, and probability, as well as assessing the amount of visual overlap between the distribution of the data from two different data sets. This unit can reinforce those concepts in a real-world problem context, but they should not come before students have developed these ideas in their math classes (or working in conjunction with math and science simultaneously).
- This unit engages students in complex data analysis tasks that include a spatial and temporal component, along with other dimensions in the data.
- If this unit is taught in grade 7, teachers may want to earmark an additional day for exploring connections in initial data cards in the anchor and include an additional day or half day in both Lessons 2 and 3 for analyzing the data strips and data cards.
What are prerequisite math concepts necessary for the unit?
Throughout the unit, students will engage in mathematical thinking. They will use ideas from 6th grade CCSS related to measures of central tendency and variation to compare the distribution of trait variations in a population over time in Lessons 6 through 9. They will use ideas from 7th grade CCSS related to drawing inferences from sampling a population in Lessons 4 and 6. They will analyze and interpret scatterplots, lines of best fit, histograms, and box-and-whisker plots in Lessons 7, 9, and 10. Prerequisite math concepts that will be helpful include the following:
- CCSS.MATH.CONTENT.6.SP.A.3 Recognize that a measure of center for a numerical data set summarizes all of its values with a single number, while a measure of variation describes how its values vary with a single number.
- CCSS.MATH.CONTENT.6.SP.B.4 Display numerical data in plots on a number line, including dot plots, histograms, and box plots.
- CCSS.MATH.CONTENT.7.SP.B.3 Informally assess the degree of visual overlap of two numerical data distributions with similar variabilities, measuring the difference between the centers by expressing it as a multiple of a measure of variability.
- CCSS.MATH.CONTENT.8.SP.A.1 Construct and interpret scatter plots for bivariate measurement data to investigate patterns of association between two quantities. Describe patterns such as clustering, outliers, positive or negative association, linear association, and nonlinear association.
- CCSS.MATH.CONTENT.8.SP.A.2 Know that straight lines are widely used to model relationships between two quantitative variables. For scatter plots that suggest a linear association, informally fit a straight line, and informally assess the model fit by judging the closeness of the data points to the line.
How do I shorten or condense the unit if needed? How can I extend the unit if needed?
This is a substantial unit requiring 6-7 weeks of instructional time with 45-minute class periods. The length of the unit can be modified in the following ways. To shorten or condense parts of the unit without eliminating important sensemaking for students, consider the following:
- Lesson 1: If students are familiar with penguins, consider skipping the live penguin cameras. They will gather more information about penguins from the Data Cards for Modern Penguins and Pedro.
- Lesson 7: If your high school uses the Galápagos finch case as an anchoring phenomenon, consider using just the fish, moths, mustard plants, and swallows cases in this unit.
- Lesson 14: This lesson explicitly addresses MS-LS4-3. If you skip this lesson, you will only build towards the other five unit performance expectations.
To extend or enhance the unit, consider the following:
- Lesson 2: If students are curious about what the Latin names are for some of those structures, that further detail is provided in the teacher reference Extended Key for Penguin Structures and Behaviors.
- Lesson 3: All students will experience sorting cards and data for ancient and modern penguins. However, there are also data strips for more-incomplete ancient penguin fossils for interested students or, if time allows, your whole class. Additionally, students may complete Reading: How do scientists use fossils to figure out what an organism that lived millions of years ago may have looked like? in class as opposed to home learning.
- Lesson 4: Highly interested students may challenge using the word “all” when referring to all adult king penguins being taller than all adult Galápagos penguins, even after examining the distribution of variation in each population. If so, you might take a moment to discuss how scientists come up with the ranges of size that are listed (even though the statistics involved are beyond what we need to know for this lesson).
- Lesson 13: If you have students who are curious about the environmental factors that influenced changes in the ancient penguins millions of years ago, reading is provided.
- Lesson 14: There are two versions of the non-egg-laying embryo handout. Consider using the one with humans to give students additional data and encourage students to think about connections between all living multicellular organisms.
- Lesson 15: If time allows, consider making this a two-day lesson and giving students more time to reflect in their Progress Tracker
Unit Acknowledgements
Unit Development Team
- Jamie Deutch Noll, Unit Lead, Northwestern University
- Gail Housman, Unit Lead, Reviewer, Northwestern University
- Holly Hereau, Unit Lead, BSCS Science Learning
- Michael Novak, Field-Test Unit Lead, PD Design, and Simulation Design, Northwestern University
- Kate Cook Whitt, Writer, Maine Math and Science Academy
- Molly Ewing, Writer, The Charles A. Dana Center, The University of Texas at Austin
- Karin Klein, Writer, Independent Contractor, BSCS Science Learning
- Shelly Ledoux, Writer, The Dana Center at University of Texas – Austin
- Dawn Novak, Writer, BSCS Science Learning
- Katie Van Horne, Writer and Assessment Specialist, Concolor Research
- Lynn Farrin, Writer, Maine Math and Science Academy
- Erika Payls, Writer, Independent Contractor
- Ty Scaletta, Writer, Independent Contractor
- Wayne Wright, Writer, BSCS Science Learning
- Julia Clarke, Expert Advisor, University of Texas at Austin
- Ali Altamirano, Expert Advisor, Museo de Historia Natural–Universidad Nacional Mayor de San Marcos, Lima, Perú
- Hillary Paul Metcalf, Advisor, Boston College
- Barbara Hug, Advisor, University of Illinois- Urbana-Champaign
- Brian Reiser, Conceptual Design, Northwestern University
- Tara McGill, Field-Test Reviewer, Northwestern University
- Cindy Passmore, Unit Advisory Chair, University of California-Davis
- Misty Richmond, Teacher Advisor, James Ward Elementary School, Chicago, IL
- Ellie Kroeger, Teacher Advisor, Pilsen Academy, Chicago, IL
- Naina Panthaki, Teacher Advisor, Van Buren Middle School, New Mexico
Unit Production Team
- Sergio Salgado, Podcast Development, Furnace FPS
- BSCS Science Learning
- Stacey Luce, Editorial Production Lead and Copyeditor
- Valerie Maltese, Marketing Specialist & Project Coordinator
- Renee DeVaul, Project Coordinator
- Chris Moraine, Multimedia Graphic Designer
- Kate Chambers, Multimedia Graphic Designer
Unit External Evaluation
EdReports
EdReports awarded OpenSciEd an all-green rating for our Middle School Science Curriculum in February 2023. The materials received a green rating on all three qualifying gateways: Designed for the Next Generation Science Standards (NGSS), Coherence and Scope, and Usability. To learn more and read the report, visit the EdReports site.
NextGenScience’s Science Peer Review Panel
An integral component of OpenSciEd’s development process is external validation of alignment to the Next Generation Science Standards by NextGenScience’s Science Peer Review Panel using the EQuIP Rubric for Science. We are proud that this unit has earned the highest score available and has been awarded the NGSS Design Badge. You can find additional information about the EQuIP rubric and the peer review process at the nextgenscience.org website.

Unit standards
This unit builds toward the following NGSS Performance Expectations (PEs) as described in the OpenSciEd Scope & Sequence:
- MS-LS1-4*
- MS-LS4-1
- MS-LS4-2
- MS-LS4-3
- MS-LS4-4
- MS-LS4-6
Reference to kit materials
The OpenSciEd units are designed for hands-on learning and therefore materials are necessary to teach the unit. These materials can be purchased as science kits or assembled using the kit material list.
NGSS Design Badge
Awarded: Feb 24, 2022
Awarded To: OpenSciEd Unit 8.6: How Could Things Living Today Be Connected to the Things That Lived Long Ago?
